Influenza in Sweden – Season 2023–2024
Summary
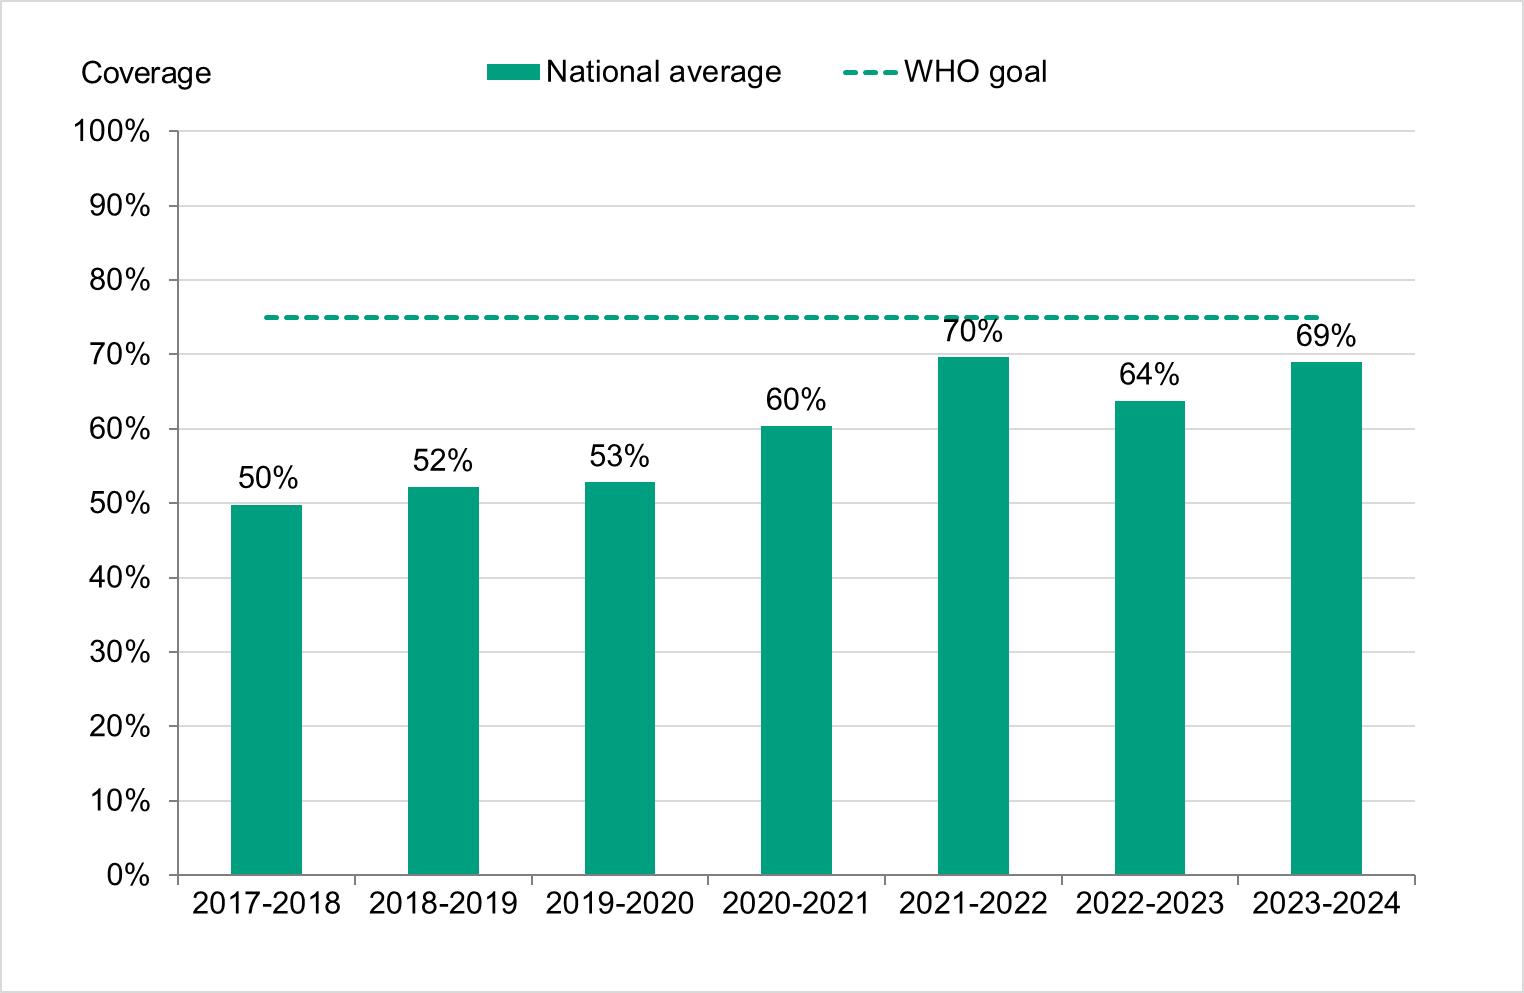
The 2023–2024 influenza season was dominated by influenza A. Vaccination coverage against influenza among persons aged 65 years or older was estimated at 69 percent, which is approximately as high as in the 2021–2022 season, and an all-time high compared with the seasons before the COVID-19 pandemic.
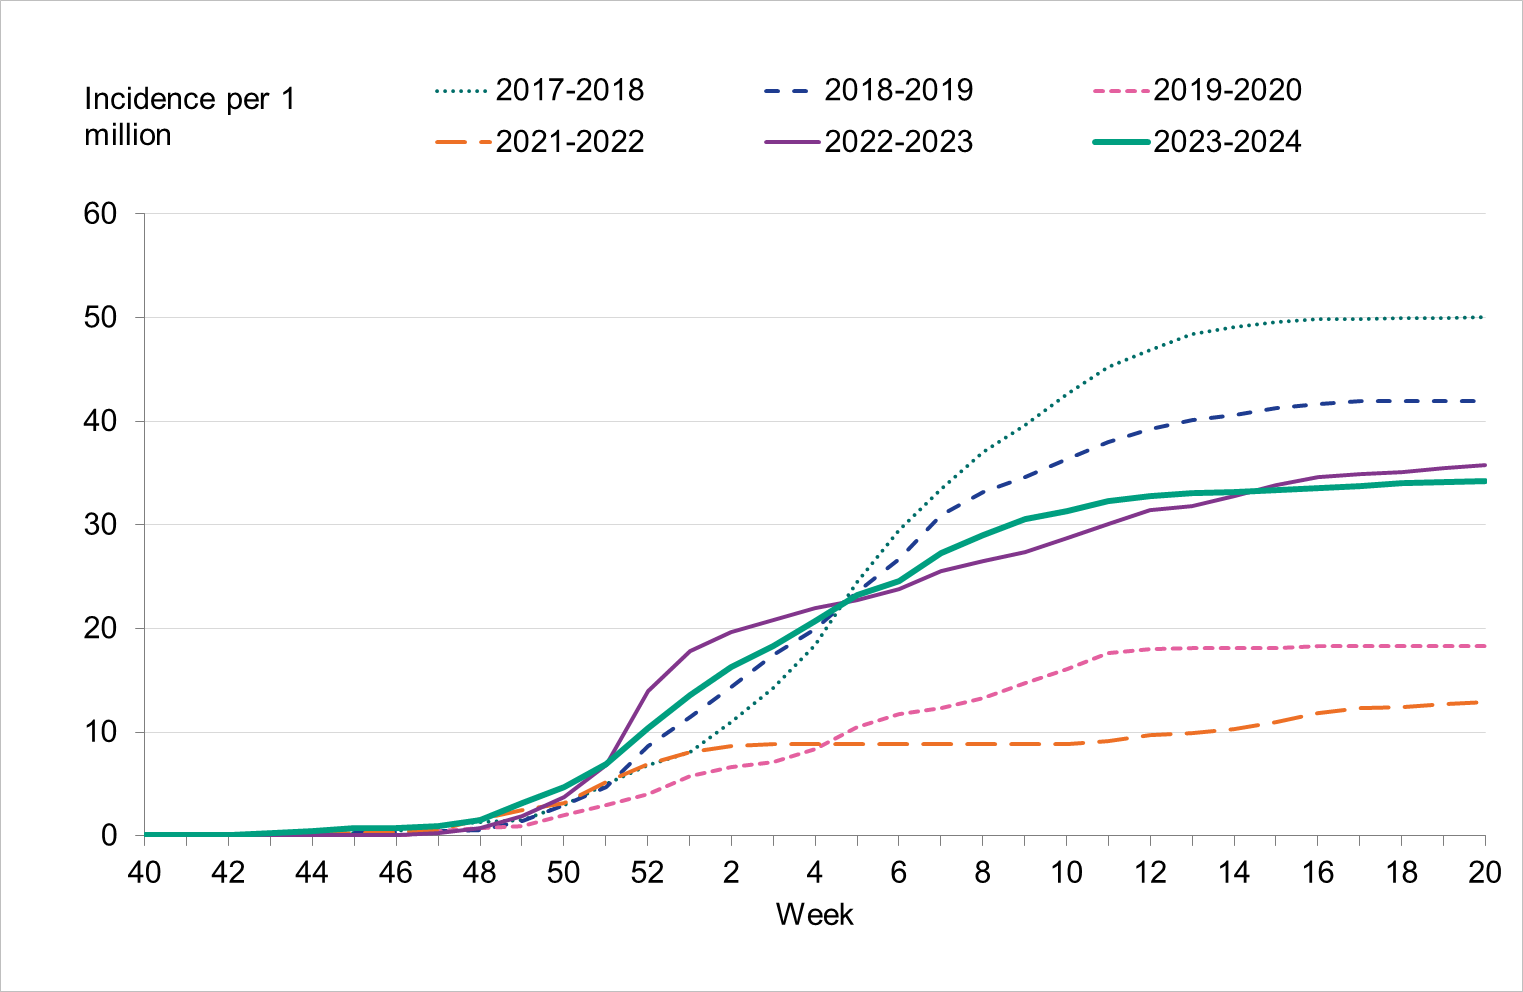
The 2023–2024 season began in week 47, and the peak of reported cases was seen in week 52. A protracted period of significant spread of influenza A continued during January and February, followed by a period in which influenza B dominated, but with a low number of reported cases. Based on data from both laboratory reporting and sentinel surveillance, influenza A(H1N1)pdm09 dominated the season, but A(H3N2) also circulated.
A high number of influenza patients with severe illness were treated with extracorporeal membrane oxygenation (ECMO) compared to previous seasons – 16 patients in total compared to between 0 and 7 in the previous four seasons. A contributing factor to this is likely that an unusually high number of influenza patients with severe illness were affected by a secondary bacterial infection with invasive group A streptococci.
A selection of influenza-positive samples received from clinical laboratories and collected through sentinel surveillance were further characterised at the PHAS. During the season, the HA gene of 261 virus isolates was characterised for genetic group affiliation. All the analysed A(H3N2) viruses belonged to subgroup 3C.2a1b.2a.2a.3a.1, which has been found to be poorly recognized by ferret antisera raised against the vaccine strains (3C.2a1b.2a.2a) indicating a mismatch. The WHO has since updated the component for the southern hemisphere 2024 and northern hemisphere 2024–2025 vaccines to subgroup 2a.3a.1. All the analysed A(H1N1)pdm09 viruses belonged to subgroups 5a.2a and 5a.2a.1, which are well recognized by ferret antisera raised against the vaccine strains (5a.2a.1). All the characterised B/Victoria lineage viruses belonged to subgroup V1A.3a.2, which is the same subgroup as the vaccine strain.
Analysis of genetic markers associated with reduced susceptibility to the neuraminidase inhibitors oseltamivir and zanamivir, the endonuclease inhibitor baloxavir marboxil, and to amantadine was performed in the NA, PA, and M genes of 262, 249, and 220 influenza viruses, respectively. Two viruses carried amino acid substitutions previously known to confer resistance to oseltamivir, and one virus carried an amino acid substitution associated with reduced inhibition by baloxavir marboxil. All Swedish influenza A viruses were resistant to amantadine. Inry, Swedish samples had low levels of resistance to currently used antivirals.
Sammanfattning
Influensasäsongen 2023–2024 dominerades av influensa A. Vaccinationstäckningen mot säsongsinfluensa bland personer 65 år och äldre var cirka 69 procent. Det är ungefär lika många personer som vaccinerades under säsongen 2021–2022 och ett betydligt högre antal jämfört med åren före covid-19-pandemin.
Säsongen 2023–2024 började vecka 47 och antalet fall av säsongsinfluensa nådde en topp under vecka 52. Under januari och februari sågs en utdragen period av fortsatt påtaglig smittspridning av influensa A, följt av en period där influensa B dominerade, men med ett lågt antal rapporterade fall. Data från laboratorierapporteringen och sentinelövervakningen visade en dominans av influensa A(H1N1)pdm09 under säsongen, men även A(H3N2) cirkulerade.
Under säsongen behandlades ett högre antal patienter med extrakorporeal membranoxygenering (ECMO) jämfört med tidigare fyra säsonger: totalt 16 patienter, jämfört med 0–7 patienter under tidigare säsonger. En bidragande orsak bedöms vara att ovanligt många influensafall drabbades av bakteriell sekundärinfektion med grupp A-streptokocker.
Ett urval av influensapositiva prover från kliniska laboratorier och sentinelövervakningen analyseras vidare vid Folkhälsomyndigheten. Under säsongen karaktäriserades HA-genen hos 261 influensastammar för genetisk grupptillhörighet:
- Alla analyserade A(H3N2)-stammar sedan september 2023 tillhörde subgrupp 3C.2a1b.2a.2a.3a.1, som antigeniskt skiljer sig från vaccinstammarna från den genetiska gruppen 3C.2a1b.2a.2a. Det tyder på en dålig matchning mellan vaccin och cirkulerande virus. WHO har sedan dess uppdaterat vaccinstammarna för södra halvklotet (säsongen 2024) och norra halvklotet (säsongen 2024–2025) till subgrupp 2a.3a.1.
- Alla analyserade A(H1N1)pdm09-stammar tillhörde subgrupperna 5a.2a och 5a.2a.1, vilka rapporteras vara väl igenkända av de antisera motvaccinstammarna i subgrupp 5a.2a.1.
- Alla cirkulerande B/Victoria-stammar tillhörde grupp V1A.3a.2, vilket är samma genetiska undergrupp som vaccinstammen.
En analys av genetiska markörer har gjorts i NA-, PA- och M-generna hos 262, 249 respektive 220 influensastammar. Markörerna är associerade med en nedsatt känslighet för neuraminidashämmarna oseltamivir och zanamivir, endonukleashämmaren baloxavir marboxil samt för amantadin. Analysen visade att två virus bar på aminosyrasubstitutioner som leder till resistens mot oseltamivir och ett virus bar på en aminosyrasubstitution som är associerad med minskad känslighet för baloxavir marboxil. Hos alla svenska stammar påvisades resistens mot amantadin. Sammanfattningsvis hade de analyserade svenska stammarna en låg förekomst av resistens mot aktuella antiviraler.
About this publication
This report describes the monitoring and surveillance systems for influenza in use during the 2023–2024 winter season and the results of both epidemiological and virological surveillance. Data are also compared to previous influenza seasons.
The report was prepared for the World Health Organization (WHO) as part of the Public Health Agency of Sweden’s function as a National Influenza Centre (NIC).
Annual reports in English about the influenza seasons in Sweden have been available since 1997, and those from 2014–2015 onward can be found on the Public Health Agency’s website (suggested search “Influenza in Sweden”) (1).
Public Health Agency of Sweden
Lena Dillner
Head of Unit
Unit for Laboratory Surveillance of Viral Pathogens and Vaccine Preventable Diseases
Anneli Carlander
Head of Unit
Unit for Coordination and Surveillance of Seasonal Viruses
Epidemiological data
Testing for influenza
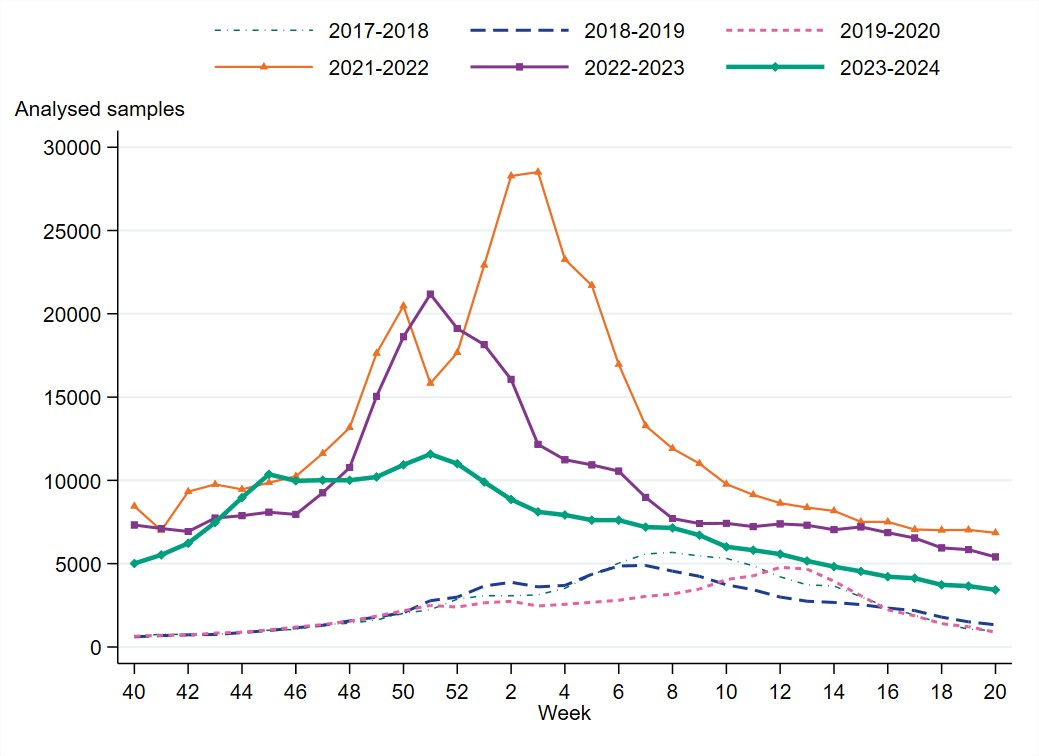
During the 2023–2024 season, approximately 240,000 samples were analysed for influenza, which is less than the two previous seasons (Figure 1). The 2023–2024 season was the first season in which approximately as many samples were analysed each week for influenza as for SARS-CoV-2 and respiratory syncytial virus (RSV), largely because many samples are analysed simultaneously for these pathogens by multiplex-PCR systems. Compared to the period before the pandemic, the number of samples analysed was significantly higher, and intensity levels and the epidemic threshold were therefore assessed based on the 2021–2022 and 2022–2023 seasons, although there were some differences in sampling during these seasons.
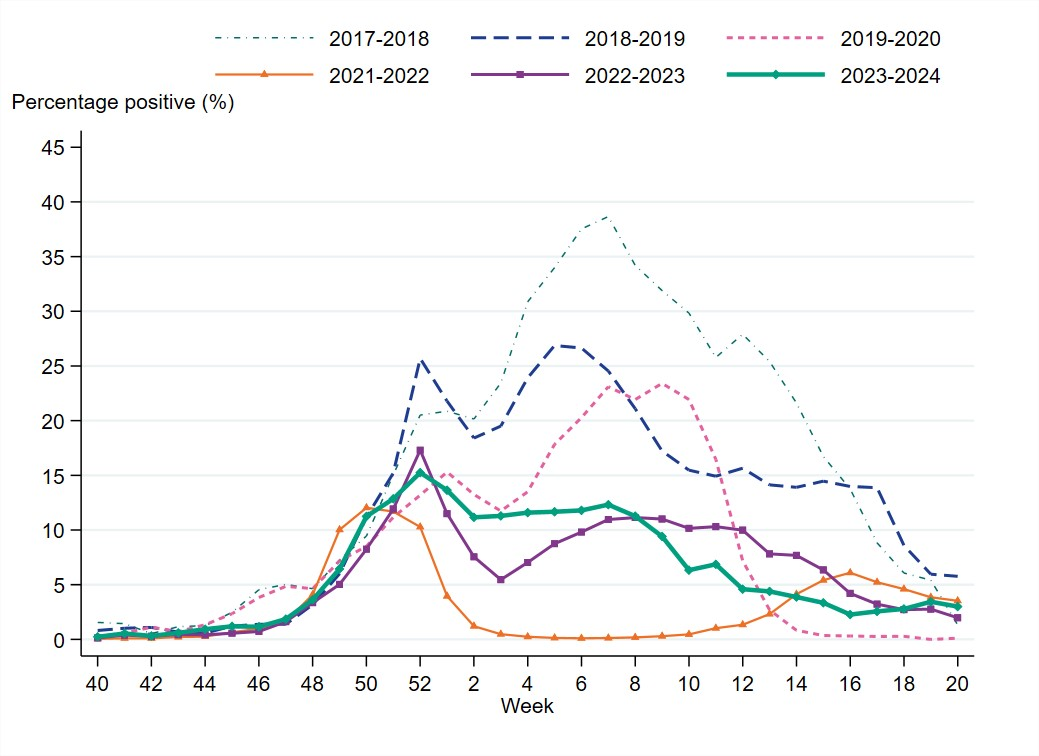
Overall, 7 percent of the samples taken during the season were positive for influenza, which was lower compared to seasons before the COVID-19 pandemic, reflecting the high levels of testing. The highest percentage of positive samples was seen in week 52 at 15 percent, see Figure 3.
Laboratory-confirmed influenza cases
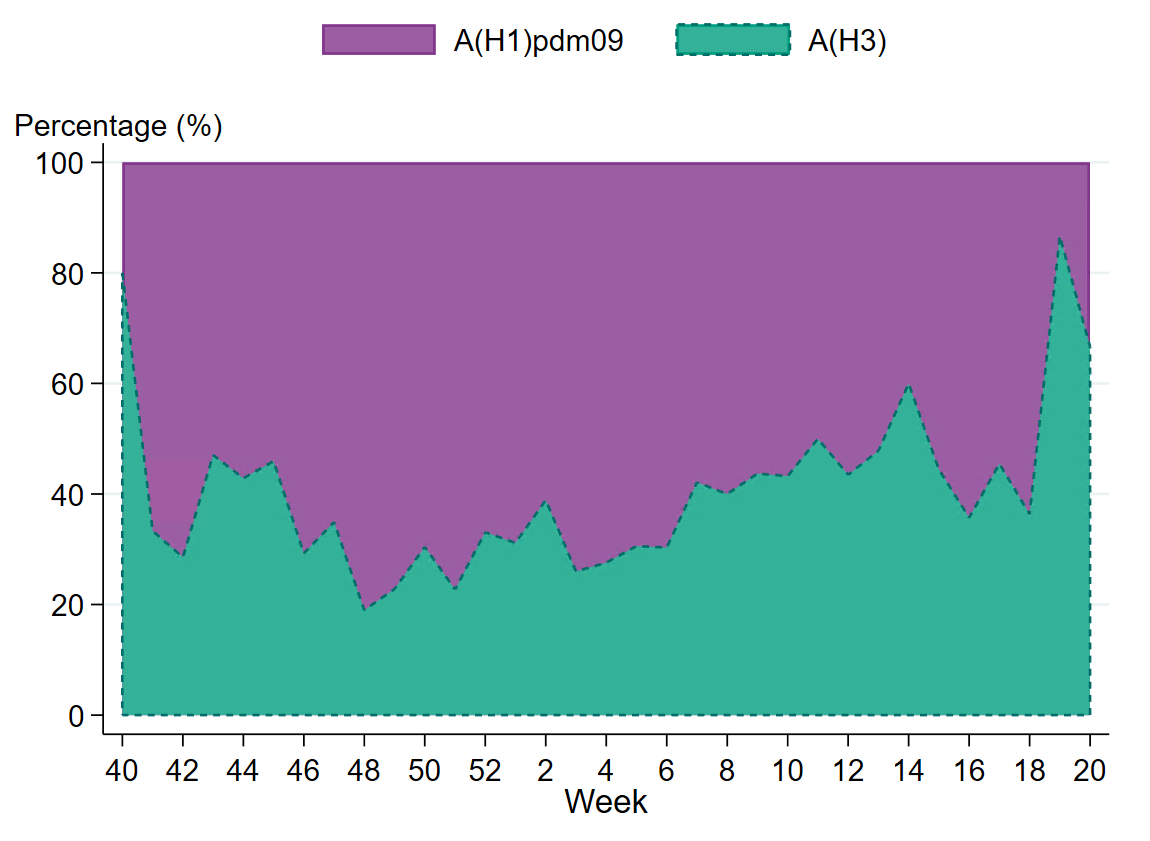
In total, 16,460 laboratory-confirmed influenza cases were reported between week 40, 2023, and week 20, 2024, of which 93 percent were influenza A and 7 percent were influenza B. Of subtyped samples, approximately 66 percent were A(H1)pdm09 and 34 percent were A(H3), see Figures 4 and 5. The overall assessment is that this influenza season had a lower intensity during the peak compared to the previous season based on data on testing, cases, intensive care, and deaths. The peak of influenza this season coincided with the peak of RSV but not with the peak of COVID-19 cases that started earlier in the season (the peak number of reported COVID-19 cases was week 45, 2023) (2, 3).
The epidemic started in week 47 based on epidemic threshold calculations (see Figure 2 and the previous section) and cases of influenza A reached the highest levels in week 52 with over 1,600 cases reported. This was followed by a prolonged period of activity with approximately 800–900 laboratory-confirmed influenza cases per week. At the beginning of March, the number of influenza A cases started to decrease, and by week 15 the majority of the laboratory-confirmed influenza cases was influenza type B, but at low levels. The influenza A and influenza B epidemics ended in week 14 and week 21, respectively, and sporadic cases continued to be reported throughout the summer.
Age and sex distribution of cases
Overall, the highest weekly and cumulative notification rate (week 40, 2023 – week 20, 2024) of laboratory-confirmed influenza and specifically of influenza A was seen among persons aged 65 years and older followed by children aged 0–4 years old, see Figures 6 and 8. These age groups are typically most affected by severe illness in an influenza epidemic and are more often sampled for influenza. This season there was a lower notification rate of laboratory-confirmed influenza (per 100,000 population) in other age groups compared to the previous season, likely as an effect of changes in testing strategy after the COVID-19 pandemic. The median age for reported cases of influenza A and B was 59 and 30 years, respectively. Slightly more women (52 percent) than men had laboratory-confirmed influenza.
Geographic distribution of cases
From week 47, 2023, to week 2, 2024, the highest weekly notification rate (per 100,000 population) of influenza A was seen in the northern and the middle parts of Sweden (Norrland and Svealand), with a peak in week 52, 2023. The peak in the southern parts of Sweden (Götaland) occurred in the same week but was not as high as in Norrland or Svealand.
Influenza cases in intensive care
A total of 335 patients in intensive care with laboratory-confirmed influenza were reported during the season, of which 316 had influenza A (94 percent) and 19 had influenza B. Among the 91 samples subtyped, 80 percent were influenza A(H1)pdm09, and 20 percent were influenza A(H3). The number of patients in intensive care during the season was comparable to season 2022–2023, during which 359 patients were admitted to intensive care, but the peak was half as high, see Figure 12. Between 2017–2018 and 2022–2023, between 110 and 450 patients were reported in intensive care per season.
The median age of patients with influenza in intensive care during the 2023–2024 season was 61 years, and the majority was men (54 percent). The highest incidence of intensive care per 100,000 population was seen among those 65 years or older followed by children aged 0–4 years and those aged 40–64 years. Nearly all patients 65 years or older who received intensive care had influenza A. There were 43 patients under the age of 18 years. Among all patients, 73 percent were in a risk group for severe disease based on underlying medical conditions or were 65 years of age or older. Among patients under 65 years of age, 54 percent were in a risk group. The most common risk groups were chronic lung disease, chronic heart disease, diabetes, and immunodeficiency.
During the season, 16 patients received ECMO treatment, of whom 11 had influenza A and five had influenza B. In total, seven of these patients’ samples were analysed for subtype/lineage, of which four were influenza A(H1)pdm09, one was influenza A(H3), and the remaining two were B/Victoria. The median age among people treated with ECMO was 38 years, and the majority were men (56 percent). Between the 2019–2020 and 2022–2023 seasons, between zero and seven patients were reported as treated with ECMO. During the intensive 2017–2018 season, when influenza B/Yamagata accounted for the majority of cases, 15 people were treated with ECMO. A contributing factor for the higher number of patients with ECMO treatment during the 2023–2024 season is likely that an unusually high number of severe influenza cases were affected by a secondary bacterial infection with invasive group A streptococci. Read more about the season's high levels of invasive group A strep in the latest weekly report.
Influenza-related mortality
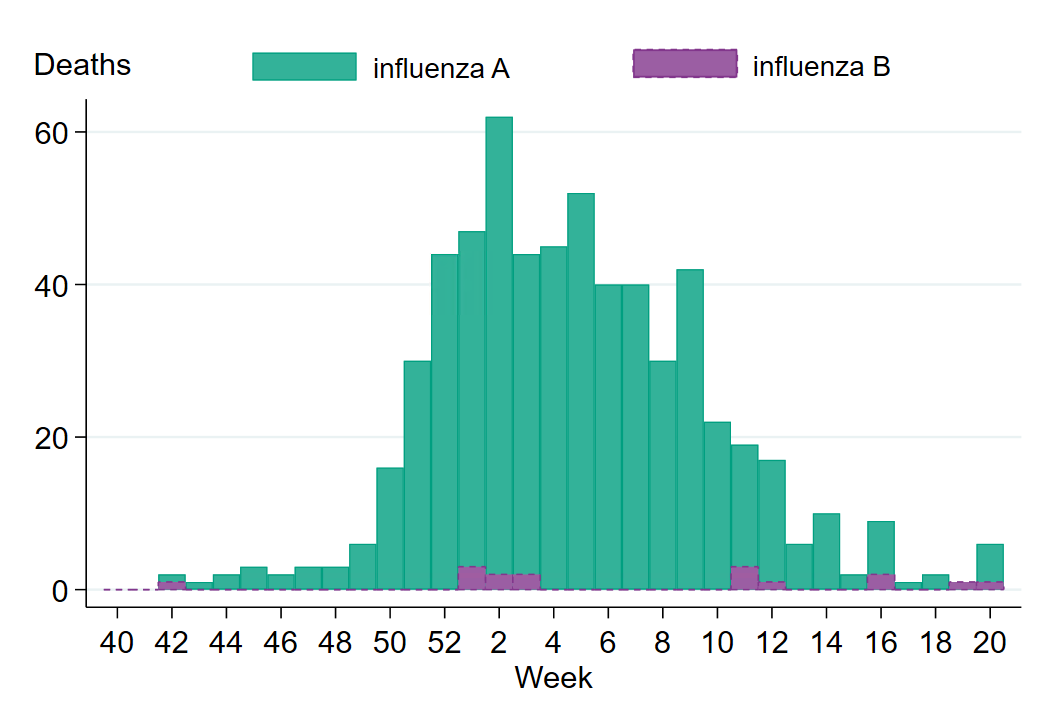
A total of 609 confirmed cases were reported to have died within 30 days of influenza diagnosis, of which 98 percent had influenza A. The median age of those who died was 83 years, and 88 percent were 65 years and older. Among persons aged 65 years and older with laboratory-confirmed influenza A or B, approximately 8 percent died within 30 days. Slightly more men than women died within 30 days of an influenza diagnosis (51 percent of the deaths were among men). The weekly number of deaths was highest in week 2, 2024, with 62 deaths, see Figure 14. Among all influenza cases, 4 percent died within 30 days of diagnosis.
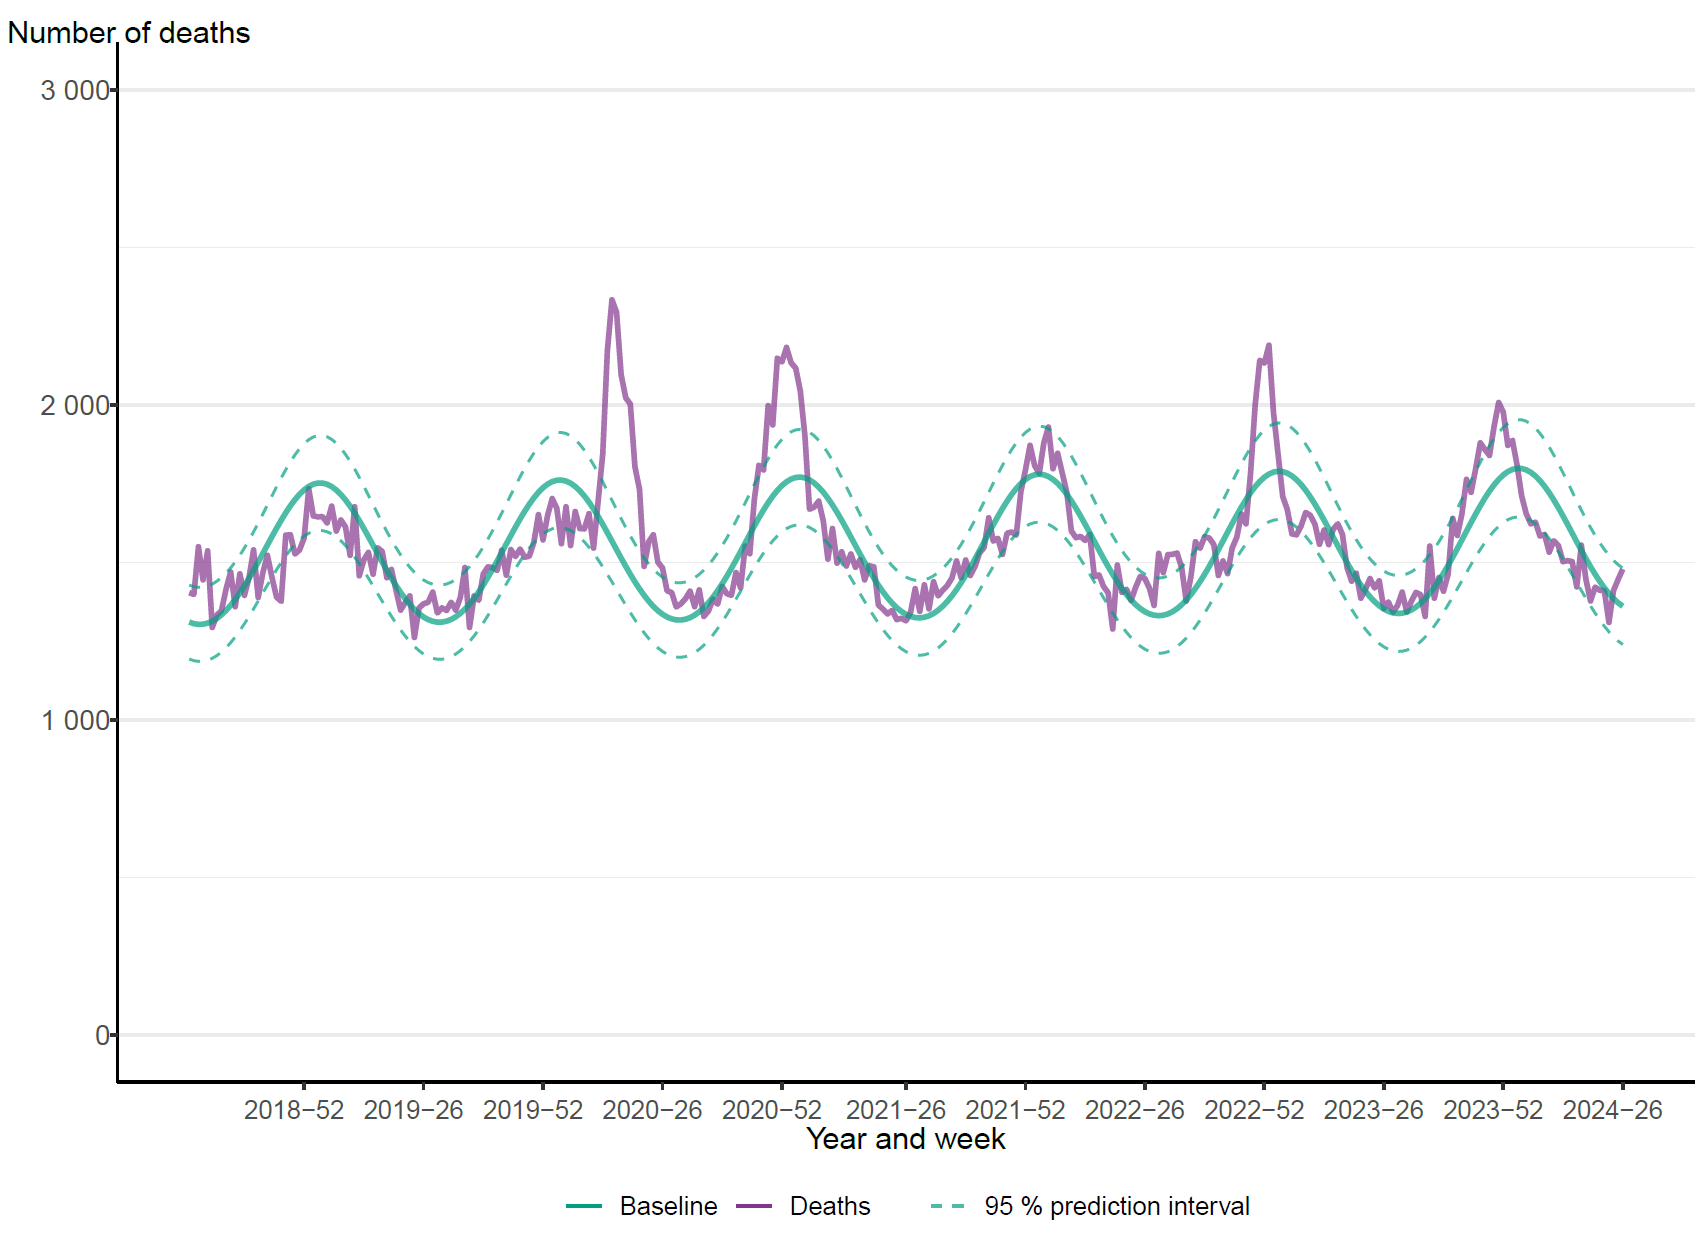
The PHAS monitors all-cause excess mortality nationally, per age group, and by region through the EuroMOMO model (5). This model indicated significant excess mortality at the national level between week 50 and week 52, 2023, for the entire population, and particularly among those 70 years and older. However, the excess mortality at the national level was lower than in the previous season. The spread of both influenza and COVID-19 likely contributed to the excess mortality. Other factors such as low temperatures and other circulating respiratory tract infections may also have contributed.
Sentinel surveillance
In sentinel surveillance, 88 of 565 analysed samples were positive for influenza (16 percent). Of these, 81 were influenza A (92 percent) and the remaining 7 samples were influenza B/Victoria. Of the influenza A positives, 78 percent were influenza A(H1)pdm09, with the rest (22 percent) being influenza A(H3). Three influenza A positives samples were not subtyped due to low viral load. Among influenza A-positives, three coinfections with SARS-CoV-2 were detected, two with influenza A(H1)pdm09 and one with influenza A(H3). The epidemic start for influenza was week 47 according to laboratory-based surveillance, and similar trends were observed in sentinel surveillance. Sampling of patients with respiratory symptoms was relatively stable in weeks 41–51, which was likely due to an earlier increase of COVID-19 cases (Figure 9). During the 2023–2024 season, 40 general practitioner sites participated in sentinel surveillance. Of the 565 patients sampled through the sentinel system with known symptoms, 81 percent had influenza-like illness (ILI) and 19 percent had acute respiratory illness (ARI). During the season, 21 percent of samples came from patients aged 65 years or older. Of those reporting vaccination status, 51 percent of patients in this age group had been vaccinated.
Data collected from the sentinel program in Sweden contributes to vaccine effectiveness studies for influenza and COVID-19 at the European level coordinated by the VEBIS network (Vaccine Effectiveness, Burden and Impact Studies) (6).
Influenza vaccination
Vaccinations began in the middle of October at long-term care facilities, where adjuvanted influenza vaccines were used. In some regions, vaccination of those aged 80 years and older was also initiated during this period. The public vaccination campaign started on November 7, 2023 (week 45), during which quadrivalent standard-dose vaccines were used. Adults in risk groups were recommended both vaccination against influenza and COVID-19. Concomitant vaccine administration was offered, with the goal of simplifying for target groups, thereby increasing vaccination coverage for both vaccines. Both individuals in risk groups and health care workers were prioritized during the first four weeks of the campaign.
Vaccination coverage against influenza among persons aged 65 years or older was estimated at 69 percent, which is approximately as high as in the 2021–2022 season, and an all-time high compared with the seasons before the COVID-19 pandemic, see Figure 15.
It is difficult to estimate vaccination coverage among the medical risk groups under 65 years of age because these groups are hard to define and because data on risk group status are not usually collected. In addition, influenza vaccinations are not entered in the national vaccination register. Based on available data, coverage among people under 65 years of age was approximately 4 percent, which is similar to previous seasons. However, vaccination coverage for COVID-19 among adults 18–64 years over the same period was 20 percent, indicating that the coverage for influenza vaccination may be higher than reflected in the available data because most individuals in risk groups were recommended both vaccinations.
Virus characterisation
Subtyping and lineage determination
All diagnostic laboratories perform influenza typing using molecular assays for influenza A and B, and some perform subtyping of influenza A. The PHAS performs subtyping and lineage typing by real-time PCR for all samples sent in from the diagnostic laboratories and on all positive samples from sentinel surveillance.
In total, 2,941 influenza A-positive samples from laboratories in Sweden were subtyped during the season, of which 1,945 (66 percent) were A(H1)pdm09 and 986 (34 percent) were A(H3). Ten subtyped samples were reported as both influenza A(H3) and A(H1)pdm09, indicating co-infections. As shown in Figure 4, the subtyped cases of both types of influenza A displayed a similar pattern, but A(H1)pdm09 increased two to three weeks ahead of A(H3). In the sentinel sampling system in primary care, 88 influenza A-positive samples were subtyped, of which 78 percent were influenza A(H1)pdm09 and 22 percent were A(H3). This is typical during seasons when both subtypes circulate because patients with samples in the sentinel system are seen in primary care and generally have milder disease.
The lineage was determined for 148 influenza B-positive samples, and all belonged to the B/Victoria lineage. The subtype and lineage of influenza-positive samples from sentinel and laboratory reporting systems are presented in Table 5.
Genotypic characterisation
A selection of the influenza-positive samples from laboratories and from the sentinel surveillance programme is genetically characterised through whole genome sequencing (NGS on an Ion Torrent platform). Samples are selected to be as representative as possible in terms of geographical location, period of collection, and type/subtype/lineage type. The Swedish laboratories are also asked to send influenza-positive samples to the PHAS from severely ill or deceased patients, patients with vaccine break-through infections, and patients who do not respond to antiviral treatment. These samples all undergo further characterisation if the viral load is sufficient. Genetic characterisation and virus isolation is usually successful for samples with a real-time PCR Ct-value ≤30.
The hemagglutinin (HA) gene is further analysed and affiliated to genetic groups in accordance with ECDC influenza characterisation guidelines. In addition, the parts of the HA gene that are the target for the subtype/lineage-specific real-time PCR systems used at the PHAS are analysed for sequence mismatches compared to primers and probes used in these systems. The NA gene is analysed with respect to amino acid substitutions previously shown to be associated with reduced or highly reduced inhibition by the NA inhibitors oseltamivir (Tamiflu®/Ebilfumin®) and zanamivir (Relenza®). The PA gene is analysed with respect to amino acid substitutions previously shown to be associated with a >3-fold increase in IC50-value for baloxavir marboxil. The matrix gene of influenza A viruses is analysed with respect to amino acid substitutions previously shown to result in resistance to amantadine. The parts of the matrix gene sequences of influenza A and B that are targets in the real-time PCR systems that are used for detection of influenza at the PHAS are analysed for mismatches to the PCR primers and probes.
A representative selection of the isolated virus samples is sent to the WHOCC in London for antigenic characterisation and for phenotypic analysis of susceptibility to NA inhibitors with the NA inhibition assay.
Characterisation data are continuously reported to the ECDC via TESSy, and sequence data are continuously uploaded to the Global Initiative on Sharing All Influenza Data (GISAID).
Genetic groups
The genetic groups of the 261 characterised Swedish influenza A and B viruses from the 2023–2024 season are shown in Tables 1, 2, and 3 by influenza subtype or lineage and in the phylogenetic trees in Appendices 1–3. Of the characterised viruses, 84 were subtype A(H3N2), 128 were subtype A(H1N1)pdm09, and 49 were lineage type B/Victoria.
| Genetic group | Number of viruses (Percentage of viruses) | Comment |
|---|---|---|
| 3C.2a1b.2a.2a (A/Darwin/9/2021) | 0 (0 %) | Genetic group affiliation of the recommended vaccine strain for the northern hemisphere, season 2023–2024 (7). |
| 3C.2a1b.2a.2a.1b (A/Catalonia/NSVH161512067/2022) | 0 (0 %) | No comments. |
| 3C.2a1b.2a.2a.3a (A/Finland/402/2023) | 0 (0 %) | No comments. |
| 3C.2a1b.2a.2a.3a.1 (A/Thailand/8/2022) | 84 (100 %) | Genetic group affiliation of the updated recommendation of vaccine strain for the northern hemisphere season 2024–2025 (7, 9). Dominant genetic group among viruses reported within the European surveillance until week 20, 2024 (8). |
| 3C.2a1b.2a.2a.3b (A/Sydney/732/2022) | 0 (0 %) | No comments. |
| 3C.2a1b.2a.2b (A/Thuringen/10/2022) | 0 (0 %) | No comments. |
| Genetic group | Number of viruses (Percentage of viruses) | Comment |
|---|---|---|
| 6B.1A.5a.2 (A/Victoria/2570/2019) | 0 (0 %) | No comments. |
| 6B.1A.5a.2a (A//Sydney/5/2021) | 61 (48 %) | Dominant genetic group among viruses reported within the European surveillance until week 20, 2024 (8). |
| 6B.1A.5a.2a.1 (A/Wisconsin/67/2022) | 2 (2 %) | Genetic group affiliation of the recommended cell-propagated vaccine strain for the northern hemisphere, season 2023–2024 and 2024-2025 (7). |
| 6B.1A.5a.2a.1 (A/Victoria/4897/2022) | 65 (51 %) | Genetic group affiliation of the recommended egg-propagated vaccine strain for the northern hemisphere, season 2023–2024 and 2024–2025 (7). |
| Genetic group | Number of viruses (Percentage of viruses) | Comment |
|---|---|---|
| V1A.3 (B/Washington/02/2019) | 0 (0 %) | No comments. |
| V1A.3a.2 (B/Austria/1359417/2021) | 0 (0 %) | Genetic group affiliation of the recommended vaccine strain for the northern hemisphere, seasons 2023–2024 and 2024–2025 (7, 9). |
| V1A.3a.2 (B/Connecticut/01/2021) | 16 (33 %) | No comments. |
| V1A.3a.2 (B/Catalonia/2279261NS/2023) | 30 (61 %) | Dominant genetic group among viruses reported within the European surveillance until week 20, 2024 (8). |
| V1A.3a.2 (B/Moldova/2030521/2023) | 3 (6 %) | No comments. |
No antigenic analyses are performed at the PHAS. The general antigenic properties of the genetic groups have, however, beenrised in the report by the WHO in conjunction with the influenza vaccine composition recommendation meeting for the northern hemisphere 2024–2025 held in February 2024 (9, 10). The antigenic analyses with ferret antisera raised against the respective vaccine strain included in the northern hemisphere vaccine for 2023–2024 are described in the following sections.
Influenza A(H3N2)
Circulating viruses since September 2023 belong to group 3C.2a1b.2a.2a.3a.1. Ferret antisera raised against viruses similar to the vaccine strain A/Darwin/6/2021 or to A/Darwin/9/2021 (genetic group 3C.2a1b.2a.2a) generally reacted well with viruses in the genetic subgroup 2a.2a, while viruses in subgroup 2a.3a.1 and 2a.2b were recognized less well. These results have been confirmed by human serology studies. Therefore, vaccine strains for A(H3N2) have been updated to egg-propagated virus A/Thailand/8/2022 and cell-propagated virus A/Massachusetts/18/2022 for southern hemisphere 2024 and northern hemisphere 2024–2025. Both of these vaccine strains belong to subgroup 2a.3a.1. All analysed Swedish virus isolates belonged to subgroup 2a.3a.1.
Influenza A(H1N1)pdm09
Circulating viruses since September 2023 have all belonged to group 6B.1A.5a.2. This group has further evolved into subgroup 5a.2a and 5a.2a.1. Ferret antisera raised against the egg-propagated vaccine strain A/Victoria/4897/2022 or against the cell-propagated vaccine strain A/Wisconsin/67/2022 reacted well to the circulating subgroups. Recommended vaccine viruses for the northern hemisphere 2024–2025 belong to subgroup 5a.2a.1. All analysed Swedish virus isolates analysed belonged to subgroups 5a.2a and 5a.2a.1.
Influenza B/Victoria
Circulating B/Victoria lineage viruses belonged to group V1A.3a.2. Viruses in group V1A.3a.2 were recognized well by antisera raised against the vaccine strain B/Austria/1359417/2021 (subgroup V1A.3a.2), and these results have been confirmed by human serology studies. All analysed Swedish virus isolates belonged to subgroup V1A.3a.2.
Influenza B/Yamagata
No B/Yamagata strains were found among positive influenza samples in Sweden or globally during the 2023–2024 season. Influenza B/Yamagata has not been detected globally since 2020.
Antiviral susceptibility
The NA gene of 85 influenza A(H3N2), 128 influenza A(H1N1)pdm09, and 49 influenza B/Victoria viruses was sequenced and analysed for amino acid substitutions previously shown to be associated with reduced or highly reduced inhibition by the NA inhibitors oseltamivir and zanamivir. Two A(H1N1)pdm09 viruses carrying amino acid substitutions associated with reduced (AARI) or highly reduced (AAHRI) inhibition by oseltamivir were detected. One virus carried substitutions S247N and H275Y, the other a mixed population of 275H and 275Y, with 275Y as the minority population. Both patients had been treated with oseltamivir. No amino acid substitutions associated with reduced or highly reduced inhibition of zanamivir were detected. Additional phenotypic results are pending from the WHOCC.
Out of 82 influenza A(H3N2), 121 A(H1N1)pdm09, and 46 B/Victoria viruses that were sequenced and analysed in the PA gene, one exhibited an amino acid substitution (L28P) associated with reduced inhibition by baloxavir marboxil. No other amino acid substitutions associated with inhibition by baloxavir marboxil were found.
The amino acid substitution S31N in the matrix protein, which confers resistance to amantadine, was present in all 220 Swedish influenza A viruses (88 A(H3N2) and in 132 A(H1N1)pdm09 viruses. Additional amino acid substitutions associated with resistance to amantadine were observed in two influenza A(H1N1)pdm09 viruses and three influenza A(H3N2) viruses. One carried amino acid substitution L26I (H1N1pdm09), and four carried substitution V27I (H1N1pdm09 and H3N2).
Virus isolation in cell culture
A subset of influenza-positive samples were grown and isolated from MDCK-SIAT1 cells. Sample selection is based on similar criteria as for genetic characterization described earlier, and a subset of the sequenced samples are chosen for isolation. Samples with a Ct-value >30, as well as samples known to have been inactivated in the laboratory, are not selected for isolation. A total of 58 viruses (21 A(H3N2), 23 A(H1N1)pdm09, and 14 B/Victoria) were successfully isolated in MDCK-SIAT1 cells. Of these, 58 virus isolates along with 57 matching clinical samples were sent to the WHOCC London for further characterisation in January and June, 2024.
Quality assessment
External quality assessment programmes provide a comparison of method performance between laboratories and are a tool to ensure accurate laboratory testing. The PHAS takes part in several external programmes and produces a panel for other Swedish laboratories. Surveillance is dependent on such standardised methods.
At the PHAS, one-step real-time RT-PCR assays are used detect influenza A and B, to subtype influenza A-positive samples, and to discriminate between the two influenza B lineages. These assays have also been optimized, implemented, and evaluated for avian influenza diagnostics. This is essential because these assays are sensitive, rapid, and can be scaled up if necessary. The PHAS continuously monitors the genomic sequences of circulating influenza strains in order to detect mutations that might affect the sensitivity of the PCR assays. The PHAS also performs in silico (computational) validation of each assay every year before the peak of the influenza season.
Every year the PHAS produces a PCR panel for Swedish laboratories on behalf of the External Quality Assessment for Clinical Laboratory Investigations (EQUALIS). This allows laboratories to measure the analytical sensitivity and specificity of their methods. The majority of the laboratories performing diagnostics for influenza use commercial PCR kits. A number of these laboratories participate in additional quality controls during the season in order to ensure that circulating influenza strains can be detected with these kits.
National quality assessment programme for influenza PCR
In September 2023, the PHAS produced a new PCR panel for Swedish laboratories, which was distributed by EQUALIS. Twenty-two laboratories participated in the panel that included ten samples in total: six influenza A and three influenza B (the cycle threshold value range was 27–31 when analysed with the in house PCR method at the PHAS), as well as one negative control sample. All laboratories reported 10/10 correct results.
Control of commercial PCR assays
Commercial PCR assays for influenza detection are widely used for diagnostic purposes and require regular quality assurance. Each fall, ahead of the influenza season, a survey is conducted to determine which PCR assays are being used by Swedish clinical microbiology laboratories. The survey also presents the option to participate in a panel in order to ensure that the PCR assays being used are able to detect currently circulating influenza strains.
For the 2023–2024 season, 18 laboratories responded to the survey and 15 laboratories were willing to participate in the quality assessment. All responding laboratories used commercial PCR assays. Thirteen laboratories were selected for participation, and 11 different commercial PCR assays were evaluated.
The following assays were evaluated:
- Xpert® Xpress CoV-2/Flu/RSV plus (Cepheid)
- Xpert® Xpress SARS-CoV-2/Flu/RSV (Cepheid)
- ALINITY m RESP-4-PLEX ASSAY (Abbott)
- BIOFIRE® FILMARRAY® Respiratory 2.1 plus Panel (BioMerieux)
- LightMix Modular Influenza A + Influenza B (Roche)
- BD MAX (BD) VIASURE Flu A, Flu B & RSV (Certest)
- BD Respiratory Viral Panel for BD MAX™ System (BD)
- VitaPCR™ (SARS-CoV-2)/Flu A/B & RSV* (Credo Diagnostics)
- QIAstat-Dx Respiratory SARS-CoV-2 Panel (Qiagen)
- GenomEra SARS-CoV-2, Flu A/B + RSV Assay Kit (Abacus Diagnostica)
- Seegene, Allplex™ SARS-CoV-2/FluA/FluB/RSV Assay
The panel consisted of eight isolates diluted in cell culture medium, including four A(H1N1)pdm09, three A(H3N2), and one B/Victoria. The cycle threshold values, when analysed with the in-house PCR-method at PHAS, varied between 28 and 32.4.
The quality assessment demonstrated that the commercial PCR assays used for influenza diagnostics were effective for the influenza strains that circulated during the season. Ary of the results was presented on the PHAS website in order to inform laboratories about the results.
In the event of methodological issues with clinical samples, Swedish clinical microbiological laboratories are welcome to contact the PHAS to compare their results or to obtain sequence data for further investigation. This service is part of our role as the National Reference Laboratory for Influenza.
External quality assessment programmes
The PHAS participated in two external quality assessment programmes during 2023, including the Annual WHO External Quality Assessment Programme for influenza and the European External Influenza virus Quality Assessment Programme (EEIQAP) panel from ERLI-Net. The results arerised below.
Annual WHO External Quality Assessment Programme for influenza
The PHAS participated in the annual WHO External Quality Assessment Panel for influenza (no. 22) during 2023.
Molecular detection, typing, and sub/lineage-typing
Fifteen samples analysed by real-time PCR were correctly typed (A, B, or negative). Seven of these were influenza A, with subtypes A(H1)pdm09, A(H3), A(H5), and A(H7) detected. One influenza A sample could not be subtyped with real-time PCR, but whole-genome sequencing established subtype A(H9), and this was confirmed in the final report. This procedure follows the routine protocol at the PHAS in cases where the influenza A subtype cannot be established but where virus titres are high enough for further investigation. Influenza A(H9) subtyping with real-time PCR is not performed at the PHAS.
Genotyping and phenotypic antiviral susceptibility determination
Genotyping analysis of the NA and PA genes was performed by NGS on an Ion Torrent platform, and the results were correct for all four samples (three influenza A(H1N1)pdm09 and one influenza B/Victoria) included in the programme. Phenotypic analysis was performed using a MUNANA-based NA inhibition assay (fluorescence-based), and the results were correct for all four samples (same samples as above).
EEIQAP 2023 European External Influenza virus Quality Assessment Programme
Molecular detection, typing, and sub/lineage-typing
Real-time PCR accurately detected the correct type, subtype, and lineage in all 11 samples analysed. One sample was negative, and for the 10 positive samples subtyping and lineage typing identified influenza A(H1)pdm09, A(H3), and B/Victoria.
Genotyping and phenotypic antiviral susceptibility determination
The NA and PA genes of 11 samples were genotypically analysed for susceptibility to oseltamivir/zanamivir and baloxavir marboxil, respectively. Phenotypic analysis of susceptibility to NA inhibitors was performed for the same 11 samples. All results for genotypic and phenotypic susceptibility to antivirals were correct.
Virus Isolation and characterisation
Eight samples were successfully isolated in concordance with the expected results. These samples were sequenced and genetic characterisation was performed. Clade designation and genetic category determination were reported correctly for seven of the eight samples. For one sample the genetic group was correct, but it should have been further categorized into a subgroup and was therefore scored as incorrect.
Tables and figures
Testing for influenza
Figure 1. Number of samples analysed for influenza data per week, per season, 2017–2018 to 2023–2024. Season 2020–2021 is excluded due to the small number of cases.
Laboratory-confirmed influenza cases
| Indicator | 2021–2022 | 2022–2023 | 2023–2024 |
|---|---|---|---|
| Analysed samples | 425,423 | 324,112 | 239,633 |
| Proportion positive samples (percent) | 3 | 7 | 7 |
| Total positive for influenza A | 13,150 | 17,848 | 15,291 |
| Total positive for influenza B | 137 | 5,167 | 1,169 |
| Total (influenza A + B) | 13,287 | 23,015 | 16,460 |
Figure 2. Total number of laboratory-confirmed cases of influenza (all types) per week and the dominating influenza type(s) per season, 2017–2018 to 2023–2024. Season 2020–2021 is excluded due to the small number of cases.
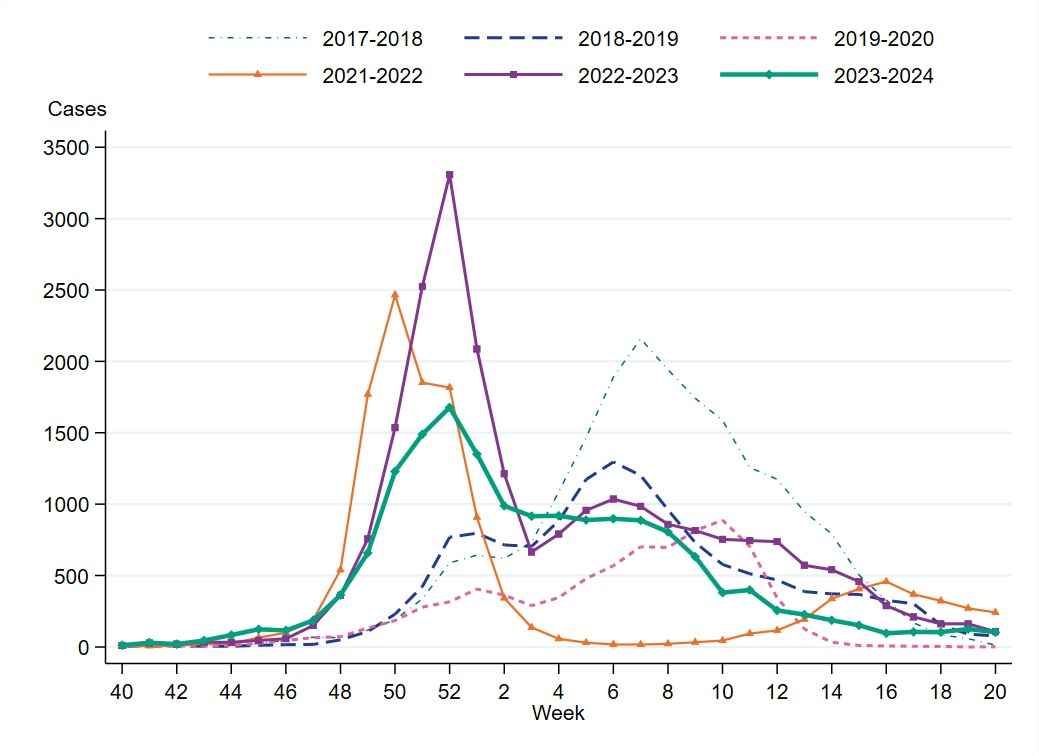
Figure 3. Percentage of samples testing positive for influenza, per week, 2017–2018 to 2023–2024. Season 2020–2021 is excluded due to the small number of cases.
Viral distribution by influenza type
| Influenza type | 2021–2022 Sent. (%) | 2021–2022 Lab (%) | 2022–2023 Sent. (%) | 2022–2023 Lab (%) | 2023–2024 Sent. (%) | 2023–2024 Lab (%) |
|---|---|---|---|---|---|---|
| A(H1N1)pdm09 | 0 | 1 | 33 | 48 | 68 | 63 |
| A(H3N2) | 100 | 98 | 47 | 34 | 20 | 32 |
| B/Victoria | 0 | 1 | 21 | 19 | 8 | 5 |
| B/Yamagata | 0 | 0 | 0 | 0 | 0 | 0 |
Note: Data on positive samples not analysed for subtype or lineage are excluded, as are samples subtyped as both influenza A(H3) and A(H1)pdm09.
Figure 4. The number of subtyped influenza A cases in the laboratory reporting system per week, 2023–2024. Please note that the figure does not include unsubtyped influenza A cases, which made up the majority of influenza A cases during the season.
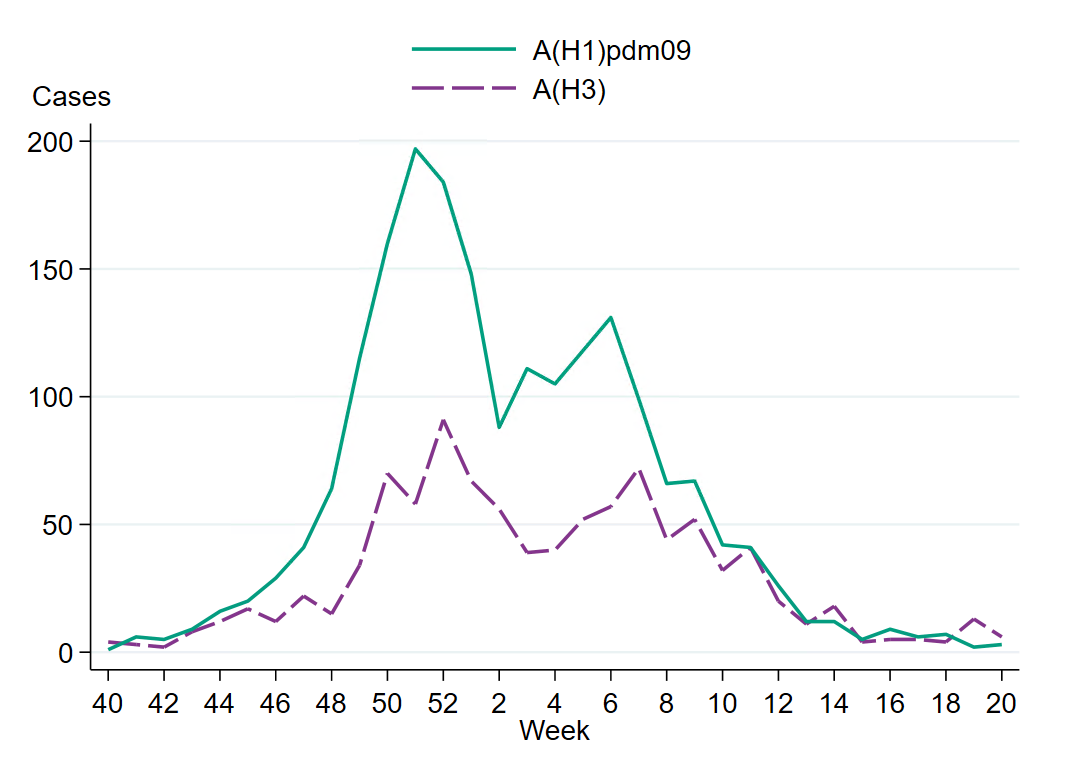
Figure 5. The weekly percentage of influenza A cases by subtype in the laboratory reporting system, 2023–2024. Please note that the figure does not include unsubtyped influenza A cases, which made up the majority of influenza A cases during the season.
Age and sex distribution of cases
Figure 6. Weekly notification rate (cases per 100,000 population) of influenza A per age group in Sweden, 2023–2024 season.
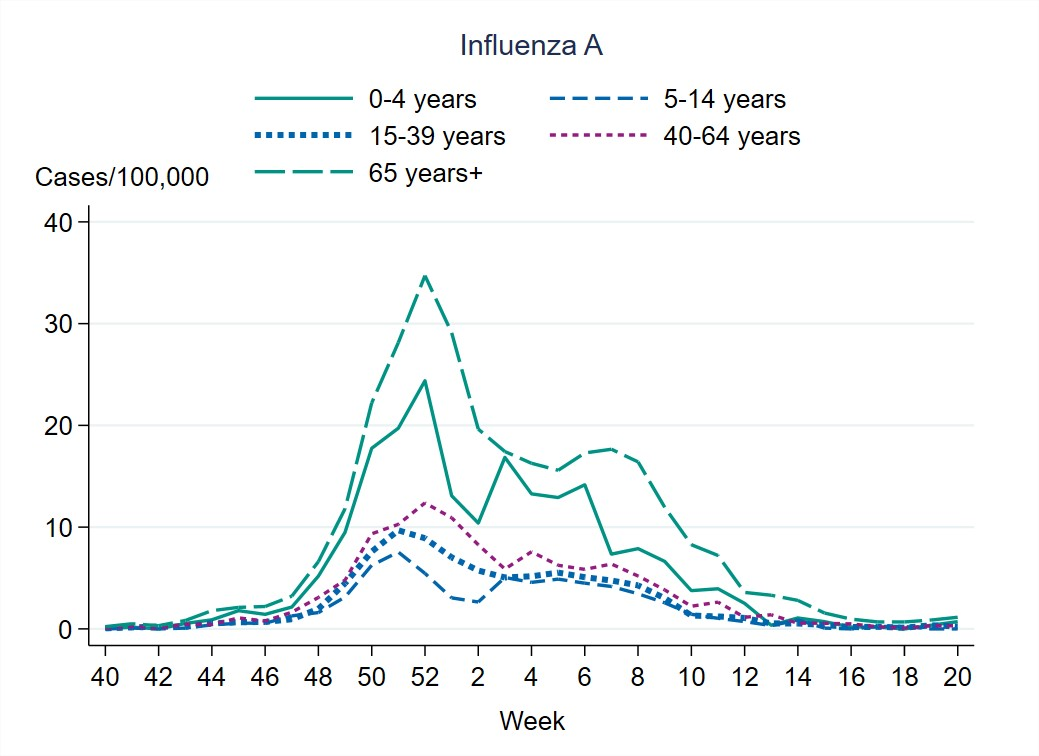
Figure 7. Weekly notification rate (cases per 100,000 population) of influenza B per age group in Sweden, 2023–2024 season.
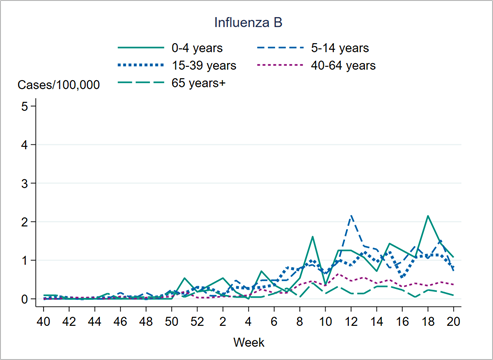
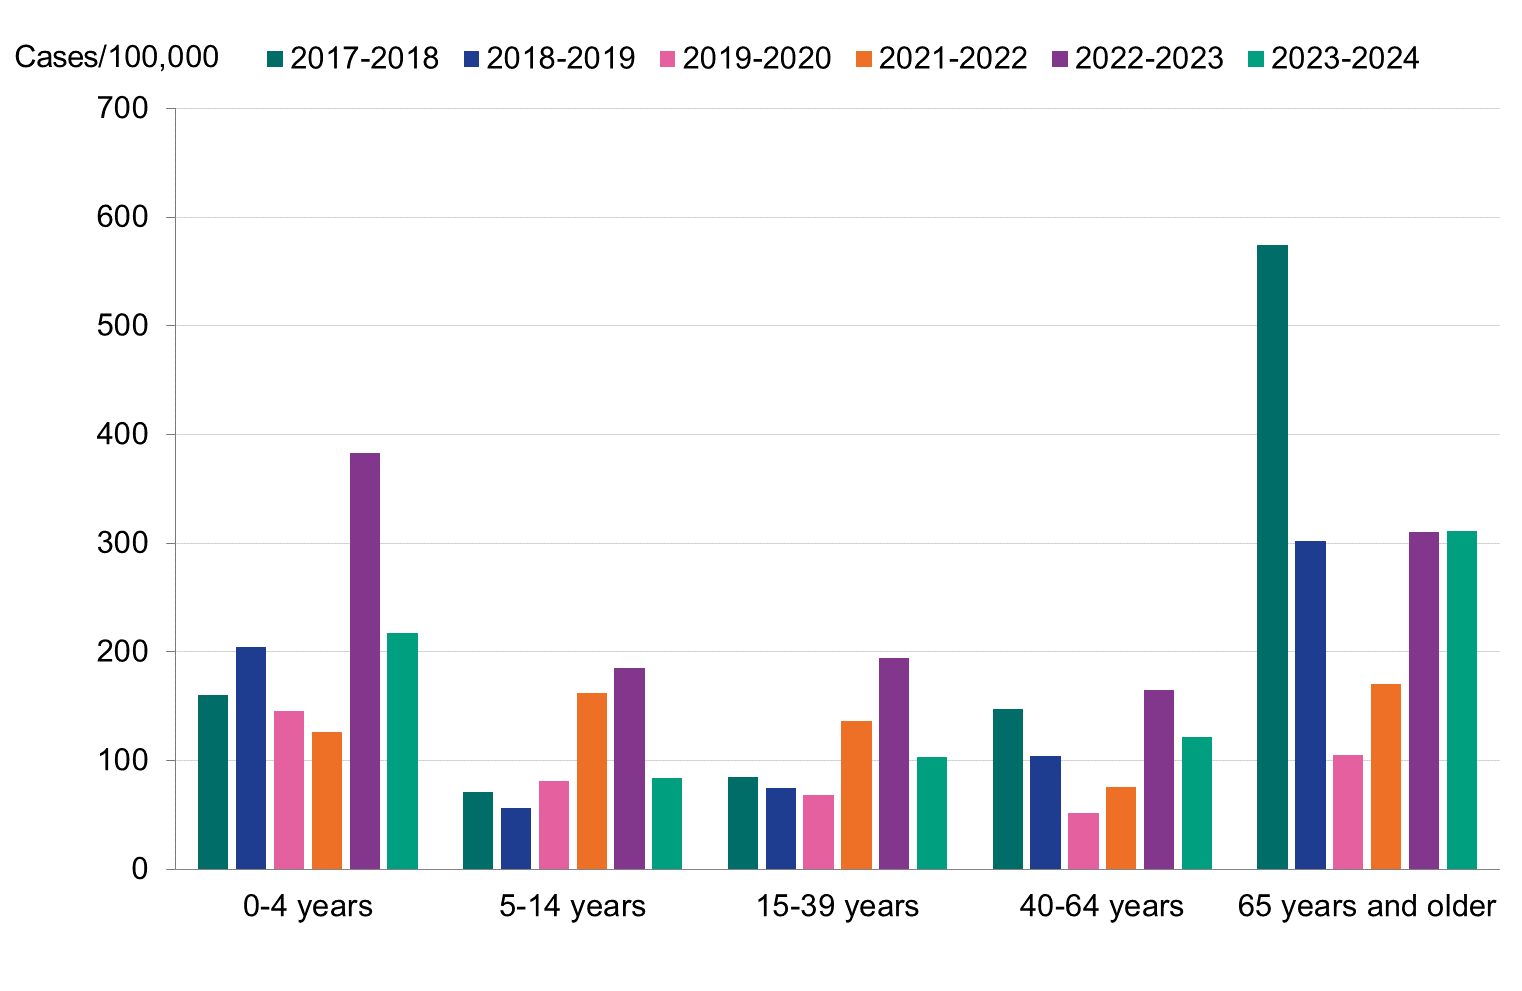
Figure 8. Cumulative notification rate (cases per 100,000 population) of laboratory-confirmed influenza cases per age group and season, Sweden, 2017–2018 to 2023–2024 seasons, in order from left to right. Season 2020–2021 excluded due to few cases.
Sentinel sampling
Figure 9. The weekly number of sentinel samples submitted and positive samples by subtype/lineage, 2023–2024. The graph also includes positive SARS-CoV-2 samples.
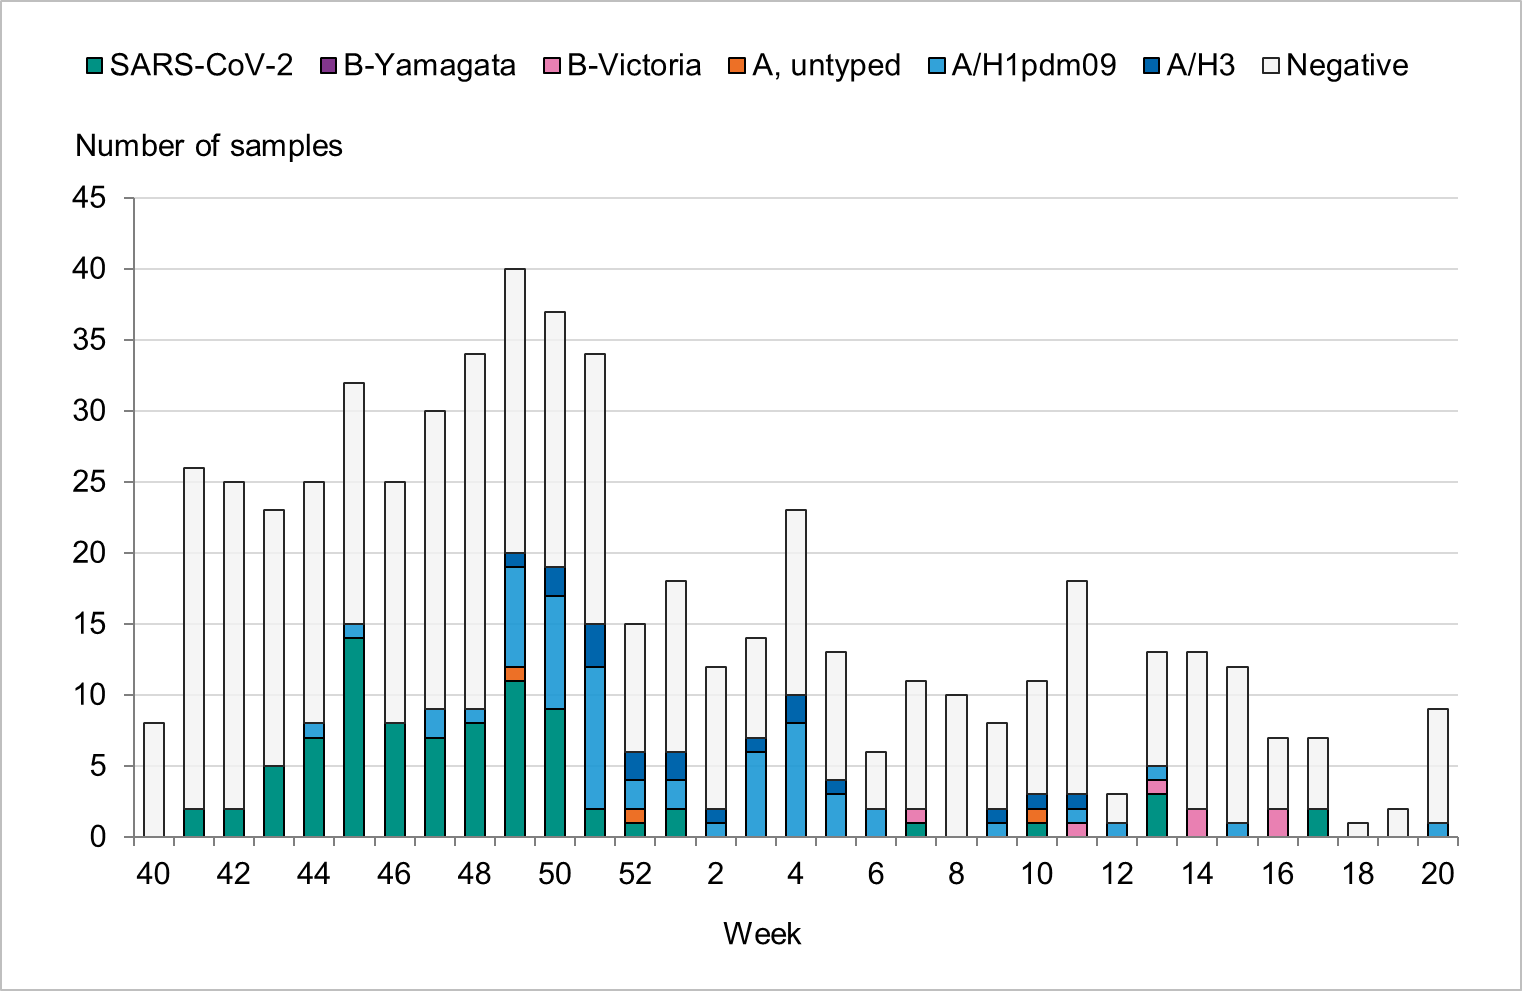
| Period | Number of samples | A/H1pdm09 | A/H3 | A, not subtyped | B/Victoria | SARS-CoV-2 |
|---|---|---|---|---|---|---|
| Weeks 40-44 | 107 | 1 | 0 | 0 | 0 | 16 |
| Weeks 45-48 | 121 | 4 | 0 | 0 | 0 | 37 |
| Weeks 49-52 | 126 | 27 | 8 | 2 | 0 | 23 |
| Weeks 1-4 | 67 | 17 | 6 | 0 | 0 | 2 |
| Weeks 5-8 | 40 | 5 | 1 | 0 | 1 | 1 |
| Weeks 9-12 | 40 | 3 | 3 | 1 | 1 | 1 |
| Weeks 13-16 | 45 | 2 | 0 | 0 | 5 | 3 |
| Weeks 17-20 | 19 | 1 | 0 | 0 | 0 | 2 |
| Total | 565 | 60 | 18 | 3 | 7 | 85 |
| Samples | 2021–2022 | 2022–2023 | 2023–2024 |
|---|---|---|---|
| Analysed | 376 | 322 | 565 |
| Negative | 324 | 247 | 477 |
| Positive | 52 | 77 | 88 |
| Proportion positive (percent) | 14 | 24 | 16 |
| Positive for influenza A | 52 | 61 | 81 |
| Positive for influenza B | - | 16 | 7 |
| Type or subtype | 2021–2022 number | 2021–2022 median age | 2021–2022 ILI (%) | 2022–2023 number | 2022–2023 median age | 2022–2023 ILI (%) | 2023–2024 number | 2023–2024 median age | 2023–2024 ILI (%) |
|---|---|---|---|---|---|---|---|---|---|
| Analysed | 376 | 51 | 90 | 322 | 47 | 81 | 565 | 47 | 81 |
| A(H1N1)pdm09 | 0 | - | - | 25 | 34 | 100 | 81 | 39 | 86 |
| A(H3N2) | 42 | 25 | 100 | 36 | 38 | 78 | 7 | 41 | 89 |
| A, not subtyped | 10 | 51 | 90 | - | - | - | 3 | 57 | 100 |
| B/Victoria | - | - | - | 16 | 33 | 100 | 7 | 29 | 100 |
| B/Yamagata | - | - | - | - | - | - | - | - |
Influenza cases in intensive care
| Type or subtype | 2021–2022 | 2022–2023 | 2023–2024 |
|---|---|---|---|
| Influenza A (not subtyped) | 84 | 196 | 225 |
| Influenza A(H1)pdm09 | 2 | 47 | 73 |
| Influenza A(H3) | 24 | 37 | 18 |
| Influenza B | 0 | 72 | 20 |
| Total | 110 | 352 | 335 |
Figure 10. Number of patients with influenza in intensive care by influenza type or subtype per week, 2023–2024 season.
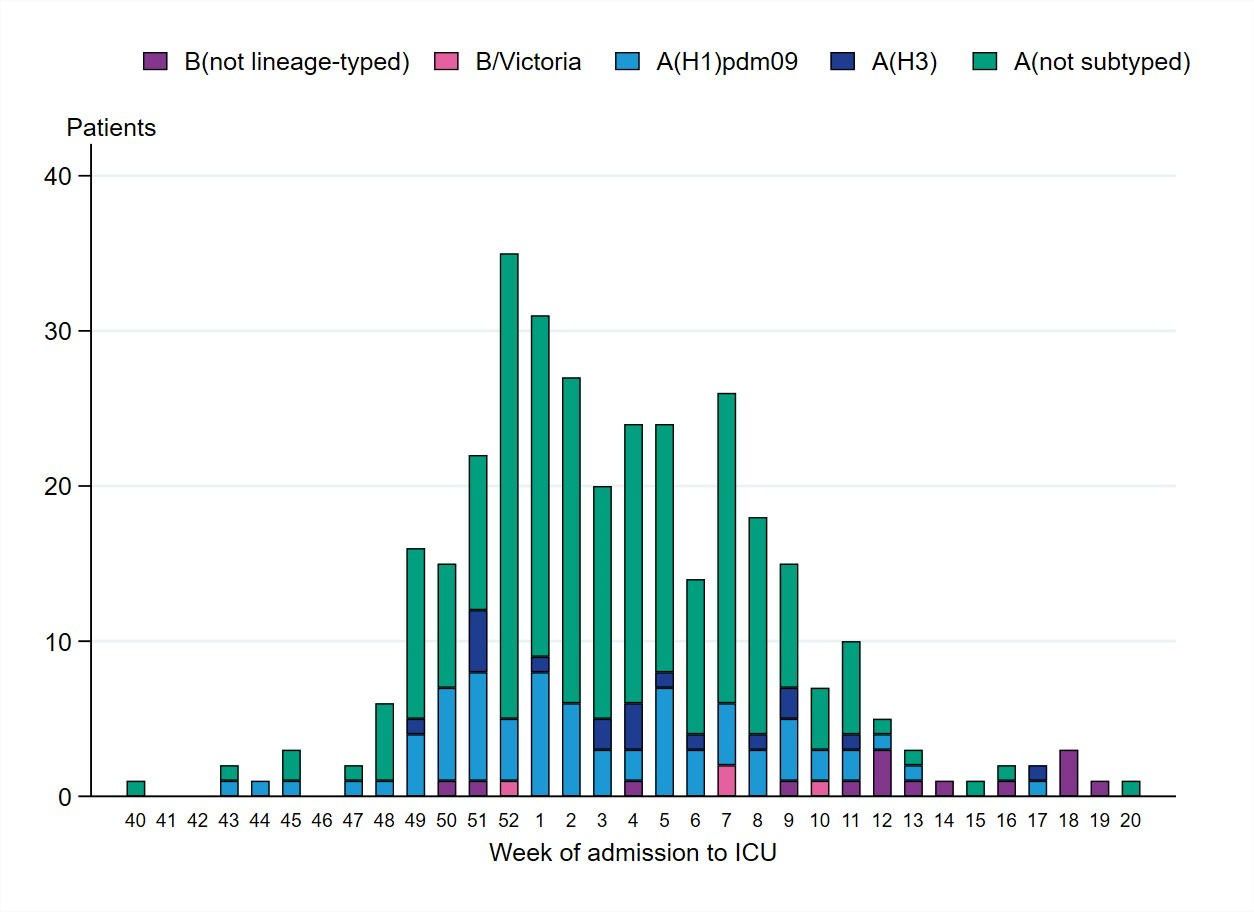
| Year-week | A/H1pdm09 | A/H3 | A, not subtyped | B/Victoria | B, not lineage typed |
|---|---|---|---|---|---|
| 2023-40 | 1 | ||||
| 2023-41 | |||||
| 2023-42 | |||||
| 2023-43 | 1 | 1 | |||
| 2023-44 | 1 | ||||
| 2023-45 | 1 | 1 | |||
| 2023-46 | |||||
| 2023-47 | 1 | 1 | |||
| 2023-48 | 1 | 5 | |||
| 2023-49 | 4 | 1 | 11 | ||
| 2023-50 | 6 | 8 | 1 | ||
| 2023-51 | 7 | 4 | 9 | 1 | |
| 2023-52 | 4 | 29 | 1 | ||
| 2024-01 | 8 | 1 | 22 | ||
| 2024-02 | 6 | 21 | |||
| 2024-03 | 3 | 2 | 15 | ||
| 2024-04 | 2 | 3 | 18 | 1 | |
| 2024-05 | 7 | 1 | 16 | ||
| 2024-06 | 3 | 1 | 10 | ||
| 2024-07 | 4 | 20 | 2 | ||
| 2024-08 | 3 | 1 | 14 | ||
| 2024-09 | 4 | 2 | 8 | 1 | |
| 2024-10 | 2 | 4 | 1 | ||
| 2024-11 | 2 | 1 | 6 | 1 | |
| 2024-12 | 1 | 1 | 3 | ||
| 2024-13 | 1 | 1 | 1 | ||
| 2024-14 | 1 | ||||
| 2024-15 | 1 | ||||
| 2024-16 | 1 | 1 | |||
| 2024-17 | 1 | 1 | |||
| 2024-18 | 3 | ||||
| 2024-19 | 1 | ||||
| 2024-20 | 1 | ||||
| Total | 73 | 18 | 225 | 4 | 15 |
Figure 11. Cumulative incidence (per 100,000 population) of intensive care of patients with laboratory-confirmed influenza per age group and season, Sweden, 2017–2018 to 2023–2024 seasons, in order from left to right. Season 2020–2021 is not included due to the small number of cases.
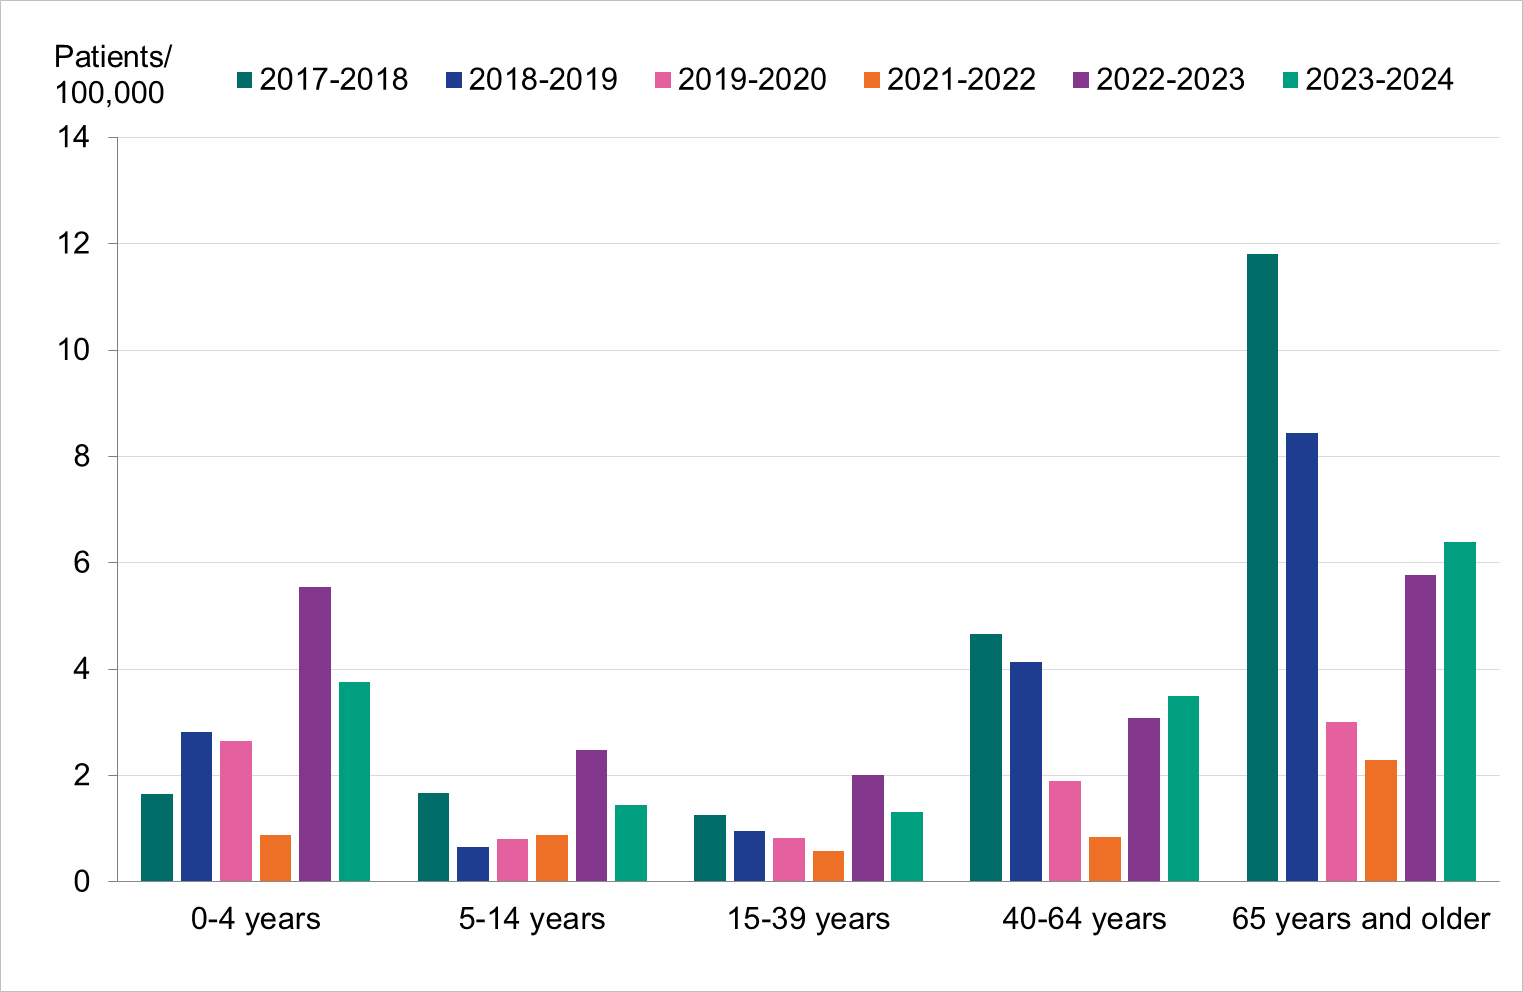
Figure 12. Weekly number of new patients with influenza in intensive care in Sweden, 2017–2018 to 2023–2024 seasons. Season 2020–2021 is not included due to the small number of cases. 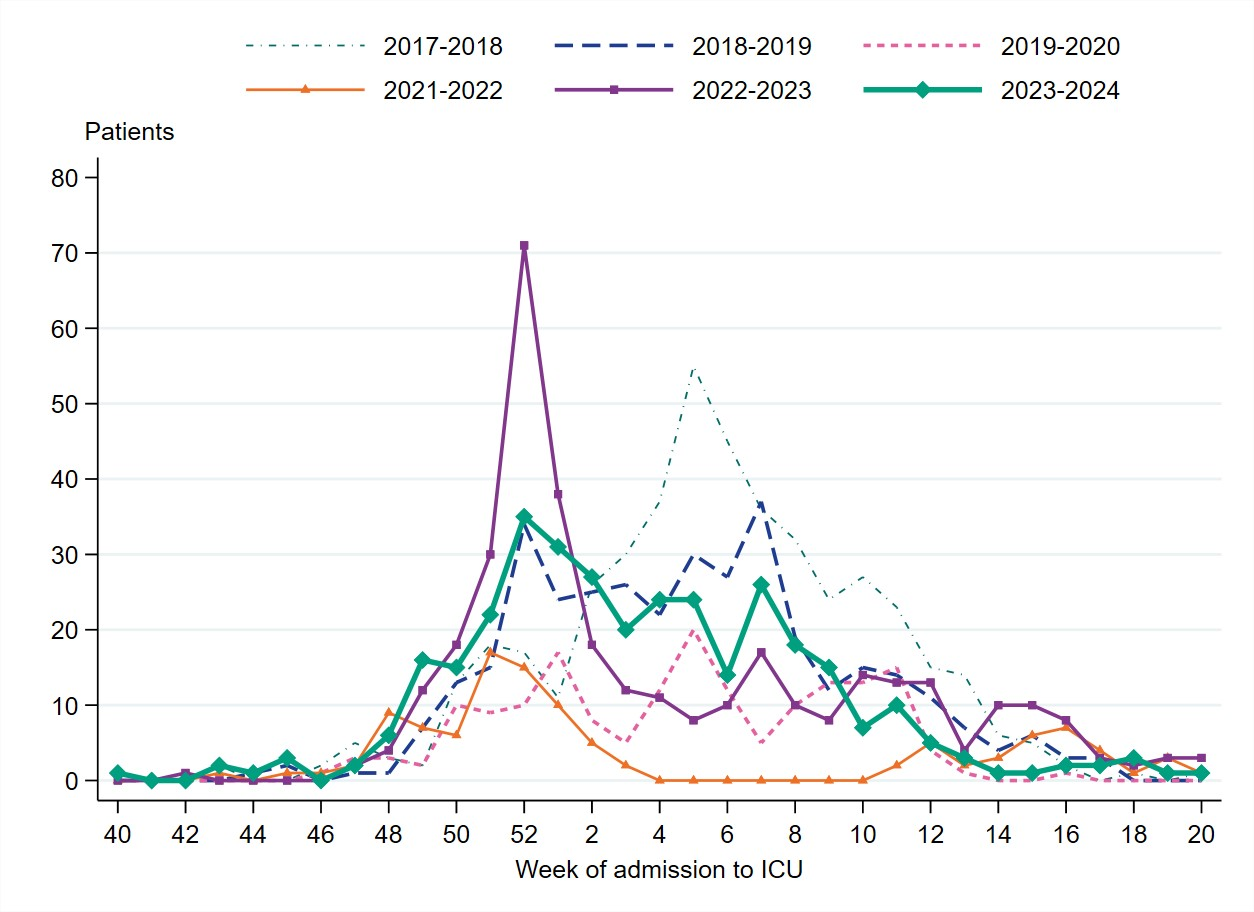
To enable comparison with the past seasons, we estimated the weekly cumulative incidence of patients in intensive care with influenza based on preliminary estimates of regional catchment population denominators. When grouped in terms of highest to lowest cumulative incidence, the seasons can be roughly separated into three groups. The first is seasons with the highest cumulative incidence, namely 2017–2018, dominated by B/Yamagata, and 2018–2019, dominated by influenza A(H1N)pdm09. The second is the middle, the 2022–2023 and 2023–2024 seasons, which both had significant transmission of both influenza A subtypes. The third is those seasons with lower cumulative incidence, namely 2019–2020, which was a season with mixed circulation of influenza viruses, and 2021–2022, which was dominated by A(H3N2). Both of these seasons were of low-medium intensity and were seasons where COVID-19 interrupted the transmission of influenza.
Figure 13. Cumulative incidence of patients with influenza in intensive care per week in Sweden, 2017–2018 to 2023–2024 seasons. Season 2020–2021 is not included due to the small number of cases.
Influenza-related mortality
Deaths within 30 days
The table below uses data on deaths retrieved from Swedish Tax Agency data on July 3, 2024, on cases from week 40, 2023, to week 20, 2024. Status after 30 days could not be ascertained for 193 cases whose personal identification number was not included in the case report.
| Indicator | <40 years> | 40–64 years | 65–69 years | 70–74 years | 75–79 years | 80–84 years | 85–89 years | 90–94 years | ≥95 years | Total |
|---|---|---|---|---|---|---|---|---|---|---|
| Total Cases | 5,681 | 3,875 | 901 | 1,044 | 1,538 | 1,400 | 1,040 | 606 | 203 | 16,288 |
| Cases/100,000 | 110 | 120 | 166 | 203 | 305 | 425 | 579 | 769 | 851 | 154 |
| Total Deaths | 7 | 64 | 40 | 42 | 85 | 126 | 116 | 86 | 44 | 610 |
| Deaths/100,000 | 0.1 | 2 | 7 | 8 | 17 | 38 | 65 | 109 | 184 | 6 |
| Deaths among cases (percent) | 0.12 | 1.7 | 4.4 | 4.0 | 5.5% | 9.0 | 11 | 14 | 22 | 3.7 |
Figure 14. Deaths among laboratory-confirmed influenza cases per week of death, 2023–2024 season. The figure does not include a small number of deaths occurring after week 20.
Excess mortality
PHAS monitors of excess mortality through EuroMoMo model, which estimates the crude excess mortality for the whole country by age group and regionally compared to baseline expected levels. Excess mortality during the winter may be related to influenza and other respiratory infections or to periods of extremely cold temperatures.
Figure 15. Number of crude and expected (baseline) deaths per week in the age group 65 years and older, Sweden, 2018 (week 27) to 2024 (week 27). The line that follows an even, wave-like pattern is the expected number of deaths, while the more varying line is the actual number of deaths per week.
Vaccination coverage
There is no national register for influenza vaccinations in Sweden, but an estimate of the vaccination coverage among persons 65 years of age and older is made by each of Sweden’s 21 county medical officers for their respective regions (also known as county councils). Various methods for estimation have been used in different regions, see Comments on vaccination data.
Coverage among persons 65 years of age and older
Figure 16. Vaccination coverage among persons aged 65 and older in Sweden, 2017–2018 to 2023–2024.
Vaccination coverage among persons under 65 years
It is difficult to estimate vaccination coverage among the medical risk groups under 65 years of age because these groups are hard to define and because data on risk group status is not usually collected. Seventeen regions (see Comments on vaccination data) have reported data that enable the estimation of coverage per age group, see Table 12.
| Indicator | 0–17 years | 18–39 years | 40–64 years | 65–74 years | 75–84 years | 85+ years |
|---|---|---|---|---|---|---|
| Percentage vaccinated 2022–2023 (%) | 0.4 | 2 | 8 | 55 | 68 | 71 |
| Percentage vaccinated 2023–2024 (%) | 0.4 | 3 | 9 | 58 | 74 | 80 |
| Population (31 December 2023) | 1,555,952 | 2,089,333 | 2,317,868 | 749,379 | 593,584 | 201,499 |
Comments on vaccination data
Influenza vaccinations are not entered in the national vaccination register. Various methods for estimating vaccination coverage among persons 65 years of age and older have been used in each of the 21 Swedish regions, including the use of vaccination registries, the number of vaccine doses given or distributed, sentinel reports on vaccination coverage, surveys among general practitioners, and patient record data. These methodological differences result in coverage estimates of varying quality and precision. Although the methods vary between regions, the methods within most regions have been roughly the same for the past several years, thus allowing a comparison over time.
An estimate of the vaccination coverage in age groups younger than 65 is included, using data from a subset of regions where registry data by age group are available throughout the season as well as annually. These data come from Blekinge, Dalarna, Gotland, Gävleborg, Halland, Jämtland Härjedalen, Jönköping, Kalmar, Kronoberg, Norrbotten, Skåne, Stockholm, Sörmland, Värmland, Västernorrland, Västmanland, and Östergötland.
Vaccination coverage estimates were calculated using the population data from December 31 of each year (Source: Statistics Sweden). Changes in data sources and data excluded per region are noted in the Swedish-language report published in June (11). For some regions, data sources do not include all doses given, e.g. doses given within municipal elderly care, at hospitals, or by private vaccination units.
References
- Public Health Agency of Sweden. Publikationer [Publications]. [Internet]. Stockholm: Public Health Agency of Sweden; 2023 [cited 2023-07-04] Available from: https://www.folkhalsomyndigheten.se/publikationer-och-material/publikationer/
- Public Health Agency of Sweden, Säsongssammanfattning RS-virus 2023–2024 [Summary of the RSV Season 2023-2024]. [Internet]. Stockholm: Public Health Agency of Sweden; 2024 [cited 2024-07-28] Available from: https://www.folkhalsomyndigheten.se/folkhalsorapportering-statistik/statistik-a-o/sjukdomsstatistik/rsv-veckorapporter/arkiv-for-rsv-veckorapporter/sasongsrapport-for-rs-virus/sasongssammanfattning-rs-virus-20232024/
- Public Health Agency of Sweden, Veckorapport om covid-19, vecka 21 2024, och sammanfattning av perioden vecka 22 2023 – vecka 21 2024 [Weekly Report for Week 21, 2024, andry of the Period Week 22, 2023, to Week 21, 2024]. [Internet]. Stockholm: Public Health Agency of Sweden; 2024 [cited 2024-07-28] Available from: https://www.folkhalsomyndigheten.se/folkhalsorapportering-statistik/statistik-a-o/sjukdomsstatistik/covid-19-veckorapporter/arkiv-for-covid-19-veckorrapporter/arkiv-for-covid-19-veckorapporter-2024/
- Public Health Agency of Sweden, Invasiva grupp-A streptokocker (iGAS) veckorapporter [Weekly Report about Invasive Group A Streptococci]. [Internet]. Stockholm: Public Health Agency of Sweden; 2024 [cited 2024-07-28] Available from: https://www.folkhalsomyndigheten.se/folkhalsorapportering-statistik/statistik-a-o/sjukdomsstatistik/invasiva-grupp-a-streptokocker-igas-veckorapporter/
- EuroMOMO Reports and Publications, [Internet]. Denmark: Statens Serum Institut; 2024 [cited 2024-07-28] Available from: https://euromomo.eu/how-it-works/reports-and-publications
- Maurel Marine, Howard Jennifer, Kissling Esther, et la., on behalf of the European IVE group. Interim 2023/24 influenza A vaccine effectiveness: VEBIS European primary care and hospital multicentre studies, September 2023 to January 2024. Euro Surveill. 2024;29(8):pii=2400089. https://doi.org/10.2807/1560-7917.ES.2024.29.8.2400089
- World Health Organization, Recommendations announced for influenza vaccine composition for the 2024-2025 northern hemisphere influenza [Internet]. Geneva: World Health Organization; 2024. [published 2024-02-23, cited 2024-07-16]. Available from: https://www.who.int/news/item/23-02-2024-recommendations-announced-for-influenza-vaccine-composition-for-the-2024-2025-northern-hemisphere-influenza-season
- European Centre for Disease Prevention and Control/World Health Organisation Regional Office for Europe. European Respiratory Virus Surveillancery (ERVISS) Overview of respiratory virus epidemiology in the EU/EEA, week 40 (2023) -20 (2024). [Published n.d, cited 2024-07-17]. Available from: https://erviss.org/
- World Health Organization, Recommended composition of influenza virus vaccines for use in the 2024–2025 northern hemisphere influenza season. [Internet]. Geneva: World Health Organization; 2024. [published 2023-03-22, cited 2024-07-16]. Available from: https://www.who.int/publications/m/item/recommended-composition-of-influenza-virus-vaccines-for-use-in-the-2024-2025-northern-hemisphere-influenza-season
- Worldwide Influenza Centre, WHO CC, Report prepared for the WHO Consultation on the Composition of Influenza Vaccines for the Northern Hemisphere 2024-2025. [Internet]. London: Francis Crick Institute; 2024. [published February 2024, cited 2024-07-17]. Available from: https://www.crick.ac.uk/sites/default/files/2024-05/WIC-VCM-NH202425.pdf
- Public Health Agency of Sweden, Säsongssammnafattning influensa 2023-2024 [Influenzary Report for the 2023-2024 Season]. [Internet]. Stockholm: Public Health Agency of Sweden; 2024 [cited 2024-07-18] Available from: https://www.folkhalsomyndigheten.se/folkhalsorapportering-statistik/statistik-a-o/sjukdomsstatistik/influensa-veckorapporter/arkiv-for-influensa-veckorapporter/sasongsrapport-for-influensa/sasongssammanfattning-influensa-20232024/
Appendices
Appendices 1, 2 and 3 contain phylogenetic trees for influenza A(H3N2), influenza A(H1N1)pdm09 and influenza B/Victoria, respectively. These are available upon request. Please provide the article number and the title of the report. The registrar will notify you if your document request entails a fee.